Framing the problem
This project started with a set of ambitious questions: What is happening with scientific understanding in the climate action space? Where does interpretation break down? And what, if anything, can be done about it?
We started with two assumptions: that interpretations of climate science vary across contexts (business, policy, and daily decision-making) and that these variations shape how climate action is understood and implemented. To test and refine that problem statement, we interviewed 26 scientists, most of whom work in academia or research agencies, asking an open-ended question focused on challenges and errors encountered in the interpretation and use of climate science in practice. Participants were recruited through networks including the European Climate Pact and the Open Letter to Party Leaders community.
This allowed participants to surface a wide range of experiences, from misunderstandings and misinterpretations to issues of communication, incentives, and application. From the 145 examples they shared, we identified three key findings.
Methodology
Conversations were recorded with participants' consent and analysed thematically to find recurring patterns, points of convergence, and areas of divergence. Each of the 145 examples surfaced was coded into one of four categories (misunderstanding, lack of knowledge, misinformation, or disinformation) based on intent and mechanism. Where examples were borderline, they were coded according to the main mechanism by which the problem operates in practice, rather than by the intent behind its origin.
The findings are intended to provide directional insight rather than statistically representative results. Two limitations are worth noting. First, the sample reflects the perspectives of scientists working primarily within research and advisory contexts, with a minority working closer to media, politics, or public communications. As such, the sample might yield a distribution that is less accurate than that of scientists working primarily with the media. Second, disinformation by design tends to present itself as organic scepticism or genuine misunderstanding, which means it may be undercounted in a sample that relies on participants’ own framing of what they observed. The 65% figure for misunderstanding should therefore be read as reflecting how scientists in research and advisory roles experience the challenge, rather than as a claim about the relative prevalence of each category across all contexts.
Key findings
Four related but distinct challenges shape climate action. Each requires a different set of interventions.
To better understand the barriers to effective climate action, we analysed the examples shared by scientists and identified four distinct types of challenges. While these are often conflated in practice, they differ in intent, underlying mechanism, and associated risks; and therefore require different responses.
The table summarises these categories, outlining how each type of problem manifests, the risks it poses, and the interventions it calls for:
Misunderstanding – 65% (94/145)
Neutral
Incorrect interpretation of correct information
Confident but flawed decisions based on incorrect assumptions
Clarification of concepts; reframing mental models; decision-support tools
Some people think that if you reduce emissions, the amount of carbon in the atmosphere comes down, but that’s not the case; it stays there for decades or centuries
– Dr Richard Betts
Lack of knowledge – 26% (38/145)
Neutral
Absence of information
Inaction or delayed action due to uncertainty or low confidence
Awareness raising; accessible education; exposure to key concepts
They don’t like to hear about the statistics. They just like to hear about what the impacts are… once I started to talk about (…) the 20-year average compared to this baseline period, it’s already too technical
– An expert on climate risks and resilience
Misinformation – 4% (6/145)
Accidental
Incorrect sharing
Decisions based on inaccurate external inputs
Fact-checking; source verification; improved information quality
There is so much misinformation and misquoting of statistics on bioenergy, carbon capture and storage. The public perception is completely 180 degrees from the scientific reality
– Dr Astley Hastings
Disinformation – 5% (7/145)
Deliberate
Manipulation
Distortion of decision-making and public perception
Regulation; transparency; counter-narratives and accountability
The purpose of the hack [Climategate] in the first place, presumably, was to try and just spread discord and misinformation
– Dr Neil Jennings
The dominant barrier is interpretation, not access to information
Misunderstandings account for 65% of the examples in the dataset; a figure that holds consistently across scientific domains, professional contexts, and levels of expertise. The main challenge is not that people lack access to climate information. It is that they find it difficult to interpret what it means.
Misunderstandings appeared consistently in how evidence is read (e.g., averages and baselines), how uncertainty is interpreted (e.g., confidence intervals, scenarios, probability), and how impact is assessed (e.g., scale, relative importance, system effects).
Scientists are comfortable with viewing numbers flexibly, e.g., in terms of accuracy vs precision, uncertainty ranges, and probabilistic reasoning. Most non-specialists, however, interpret numbers as fixed and definitive, more akin to financial figures than to scientific estimates. As a result, the same data can lead to very different conclusions. A confidence interval becomes grounds for dismissing a finding. A range of scenarios becomes evidence of confusion. A probabilistic projection becomes an unreliable forecast.
“If you tell a stakeholder that precipitation may increase by 20%, that information is not automatically useful. How can they act on this information? When we are talking about statistics, percentages or deviations from the mean, they are difficult to translate into practical decisions. What does it mean for your company, your operations or even for your family, for you personally.”
– Dr Anastasia Lobanova
Misinterpreted data leads to decisions of misplaced priorities, delayed action, and misallocated resources. Interventions that are visible or convenient are prioritised over effectiveness. The cost of this is not abstract: it is measured in funding allocated to the wrong places, policies built on flawed assumptions, and risks that remain unidentified until they materialise.
“I wish that people would understand that global warming is not about phenomena that have never been there before. It’s about the intensity, it’s about the frequency, it’s about the duration that is changing”
– An expert on climate risks and resilience
Addressing these challenges requires strengthening how information is processed, not simply increasing its availability.
20% More Rain Per Year: Different Scenarios
The same total increase in rainfall can lead to very different outcomes depending on its distribution.
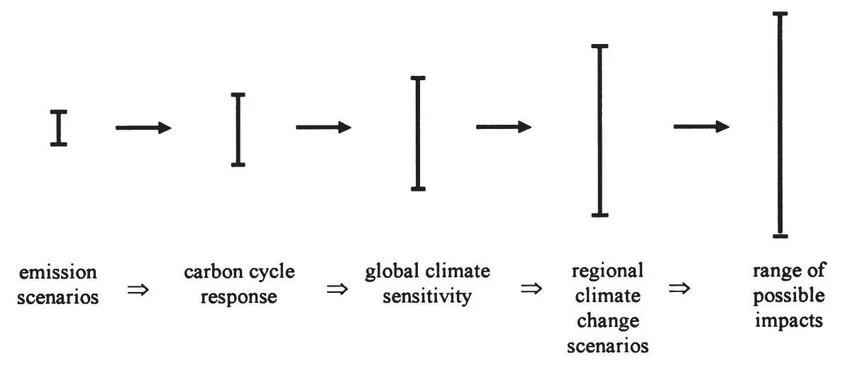
Misunderstandings compound as climate data moves through the system
Misunderstandings are not limited to a single group or level of expertise. They happen at every stage of the information journey: from analysis and advisory roles to communication, policy, and implementation.
At each stage, the same concepts (e.g., uncertainty, probability, scale) are reframed to meet different needs, bringing subtle shifts in meaning. These shifts do not remain isolated. They accumulate. An early misinterpretation, if uncorrected, can become the premise for the next decision. By the time a finding reaches the person acting on it, its meaning may have shifted substantially from the original version.
“We spend ages discussing which number to focus on, and because I’m a statistician, I always want to emphasise the uncertainty on it. And then you do this beautifully nuanced press briefing and press release in which it stresses that this is only one number, only the midpoint of an interval, and that we think it’s between this and this much more likely.”
– Dr Clair Barnes
“Sometimes it’s mind-boggling to me when people say we should reduce emissions by 90% and deliver 10% through carbon dioxide removal by mid-century. Please tell me where you got that number from. (…) Taking the average and superimposing it (…). Prescribing what the entire world, every single actor, should do by 2050 is a very bad use of science.”
– Dr Alaa Al Khourdajie
The following example illustrates how this compounding works in practice.
A regional model projects that precipitation will increase by 20% by 2040, with uncertainty across scenarios. Rainfall might arrive in a short period or be spread across the year. The information journey follows: the scientist states the complexity, the communicator publishes the “safer” scenario, the policymaker commissions a drainage review, the consultant designs for the average, and the contractor builds according to the design.
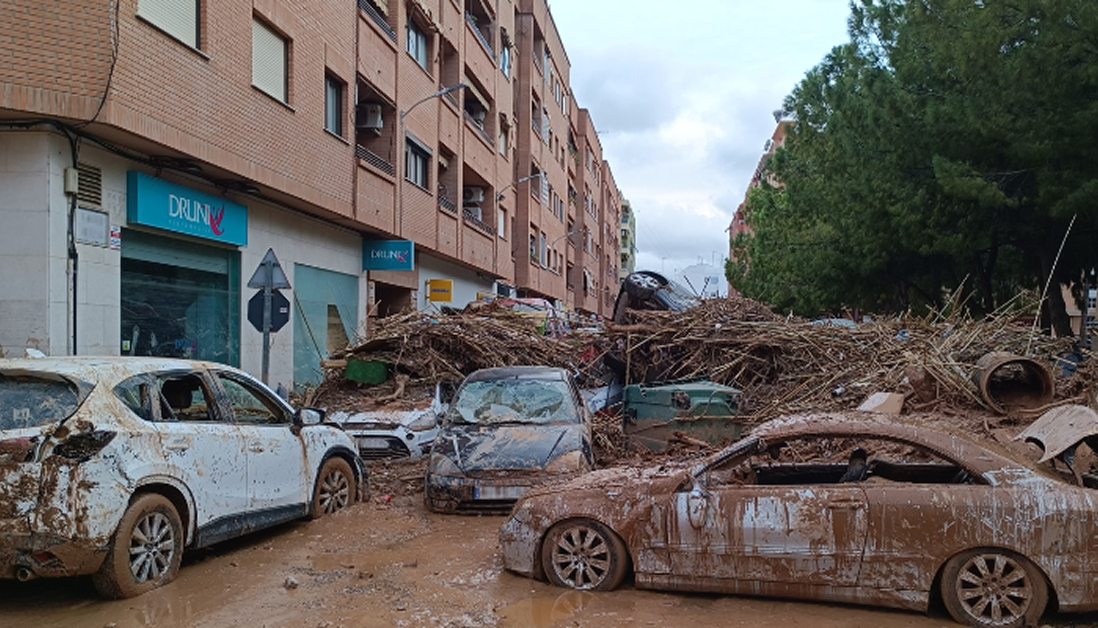
Ten years later, the city floods. Not because nobody had the information. Because at every stage, someone reasonably simplified it, and what was lost in each simplification was exactly what would have changed the decision.
A note on structural tension
The communication tools we rely on - headlines, single figures, direct attribution, and certainty - were designed for a world of straightforward causes and clear outcomes. Climate science describes something different: a world of ranges, margins, and probabilities, where what is likely matters more than what is certain, and where conditions shape conclusions. Closing that gap will require a different way of thinking about evidence itself.
What this means in practice
The evidence points to a gap rooted in how we relate to evidence itself. Currently, the scientific thinking and culture aren’t communicated alongside their content. New relationships with evidence need to be built: not through one-to-one explanation or ad hoc clarification, but through shared language that can travel across the information chain and hold its meaning at every stage.
Based on the research, three capabilities common to science are absent in the large majority of misunderstandings identified in our sample:
The ability to read statistics critically:
understanding what a number includes, what it leaves out, and what method was used to construct it, precision is not the same as accuracy.
The ability to reason with probabilities:
interpreting risk as a range of outcomes across different severities and timeframes, not a single prediction, uncertainty is information, not a reason to delay.
The ability to prioritise at the right scale:
directing effort toward where harm is greatest, and co-benefits are strongest, while being honest about what is within reach.
Together, these three capabilities form what we call science thinking: a practical methodology for working with climate evidence, applicable at every stage of the information chain. Two companion documents apply science thinking in practice.
- The Field Guide: Working with Climate Evidence is designed for decision-makers (policymakers, business leaders, and sustainability professionals) who send or receive climate information as part of their work.
- The Toolkit for Communicators: Translating Climate Science addresses the specific pressures of the translation role: working quickly, with incomplete information, and with a responsibility to an audience that will act on what they read.
We are at the beginning of this work, not the end. The framework is anchored in evidence; the tools are a first response to what that evidence implies. What is needed now is the resource to test whether they hold in practice, and partners willing to help build something genuinely useful, tested against the complexity of real decisions, and honest about what it can and cannot do.
We welcome challenge, collaboration, and conversation. If this research generates questions for your work, we would like to hear them.